

How's the Market in Rocklin, CA?
"It's a seller's market!"

"The busiest season of real estate is here (traditionally now through the end of Spring and often stretching to early Summer in our market). We are seeing homes that are priced right selling quickly and often with multiple offers and in "as is" condition." - Jim Betley

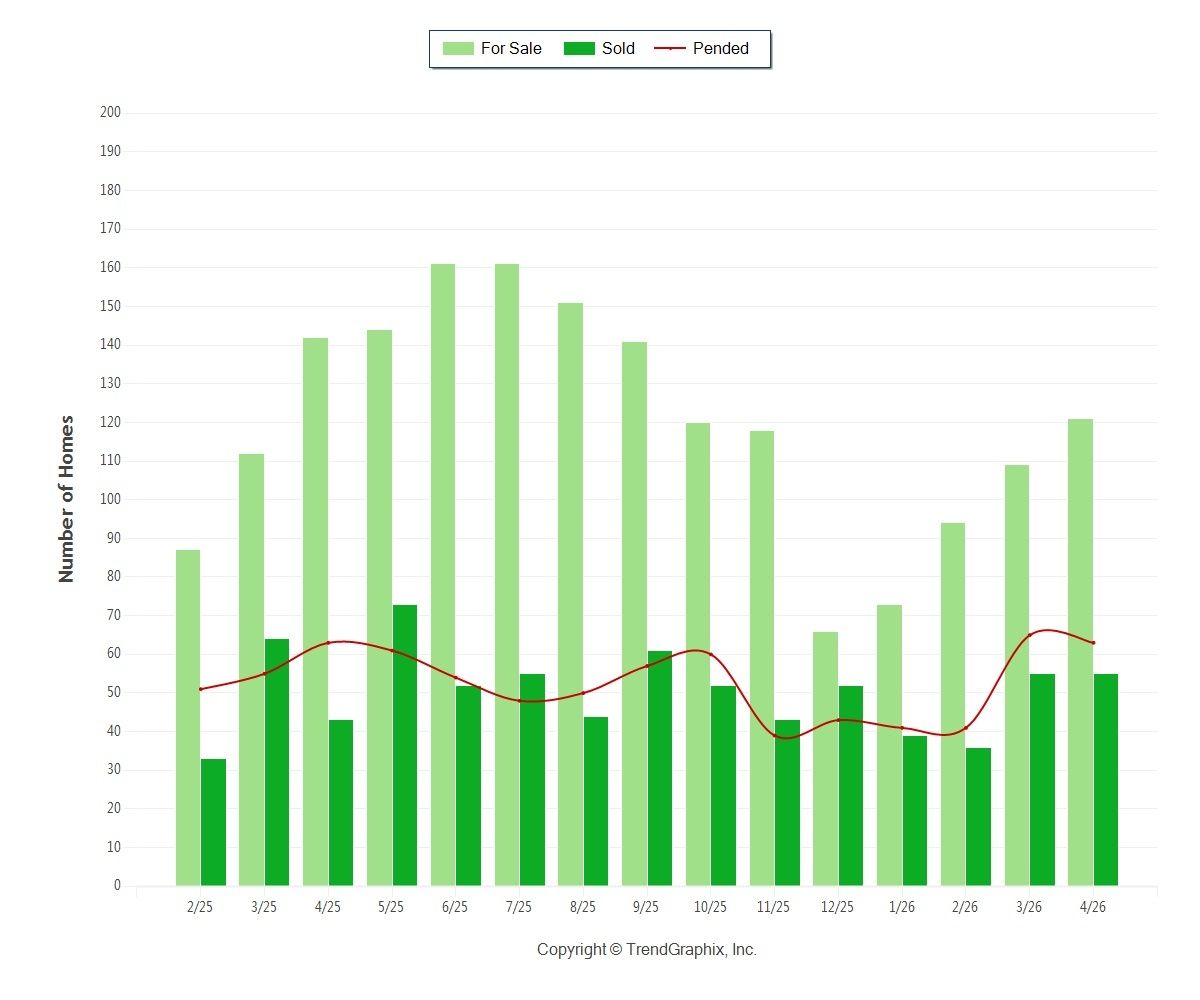
Property Sales (Sold): April property sales were 55, up 27.9% from 43 in April of 2025 and the same as sales last month.
Current Inventory (For Sale): Versus last year, the total number of properties available this month was lower by 21 units of 14.8%. This year's smaller inventory means that buyers who waited to buy may have smaller selection to choose from. The number of current inventory was up 11% compared to the previous month.
Property Under Contract (Pended):
There was a decrease of
3.1%
in the pended properties in April, with 63 properties versus 65 last month. This month's pended property sales were the same as at this time last year.
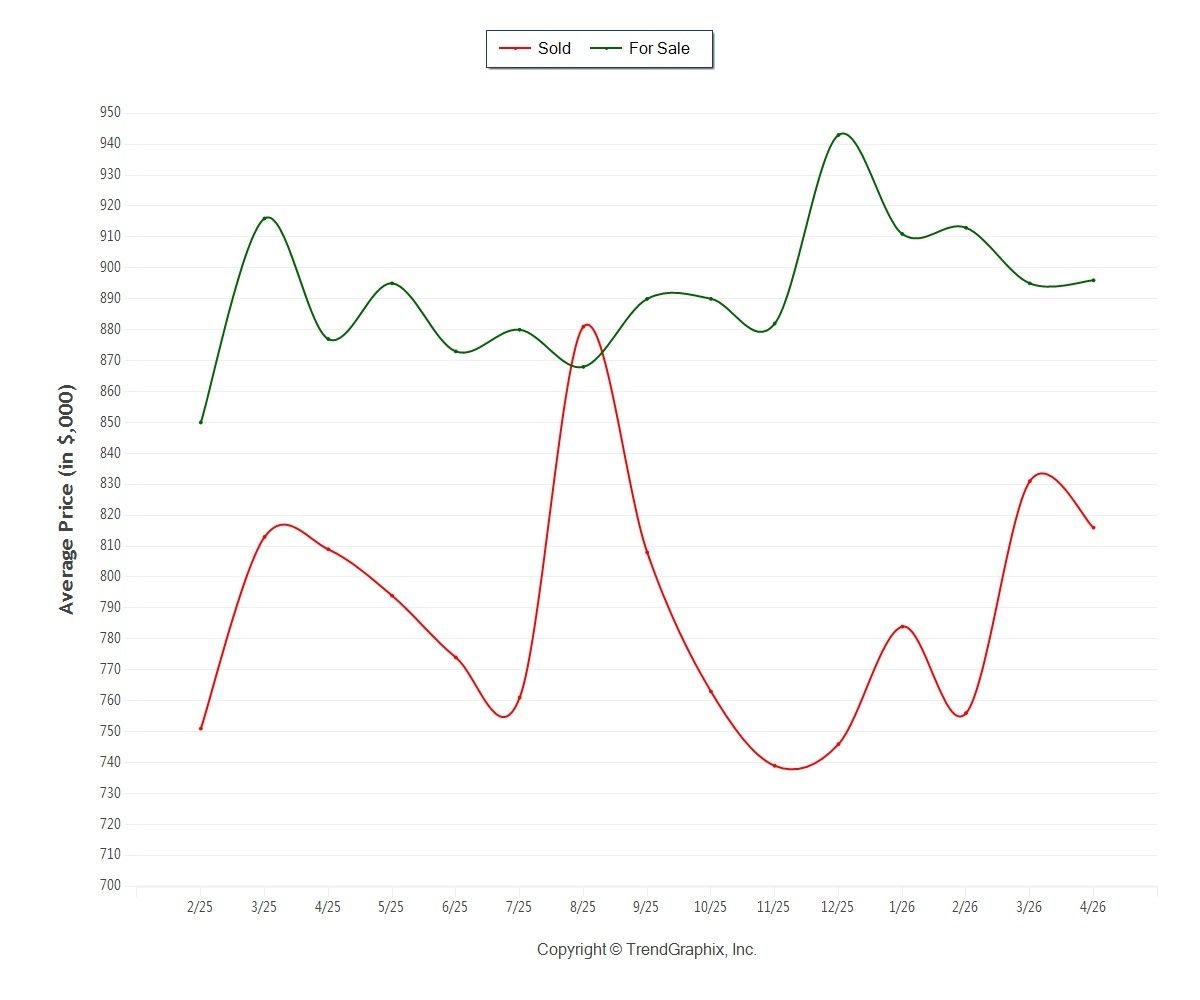
The Average For Sale Price was Neutral: The Average For Sale Price in April was $896,000, up 2.2% from $877,000 in April of 2025 and up 0.1% from $895,000 last month.
The Average Sold Price was Neutral: The Average Sold Price in April was $816,000, up 0.9% from $809,000 in April of 2025 and down 1.8% from $831,000 last month.
The Median Sold Price was Appreciating: The Median Sold Price in April was $755,000, up 0.7% from $750,000 in April of 2025 and up 4.1% from $725,000 last month.
*Based on 6 month trend – Appreciating/Depreciating/Neutral
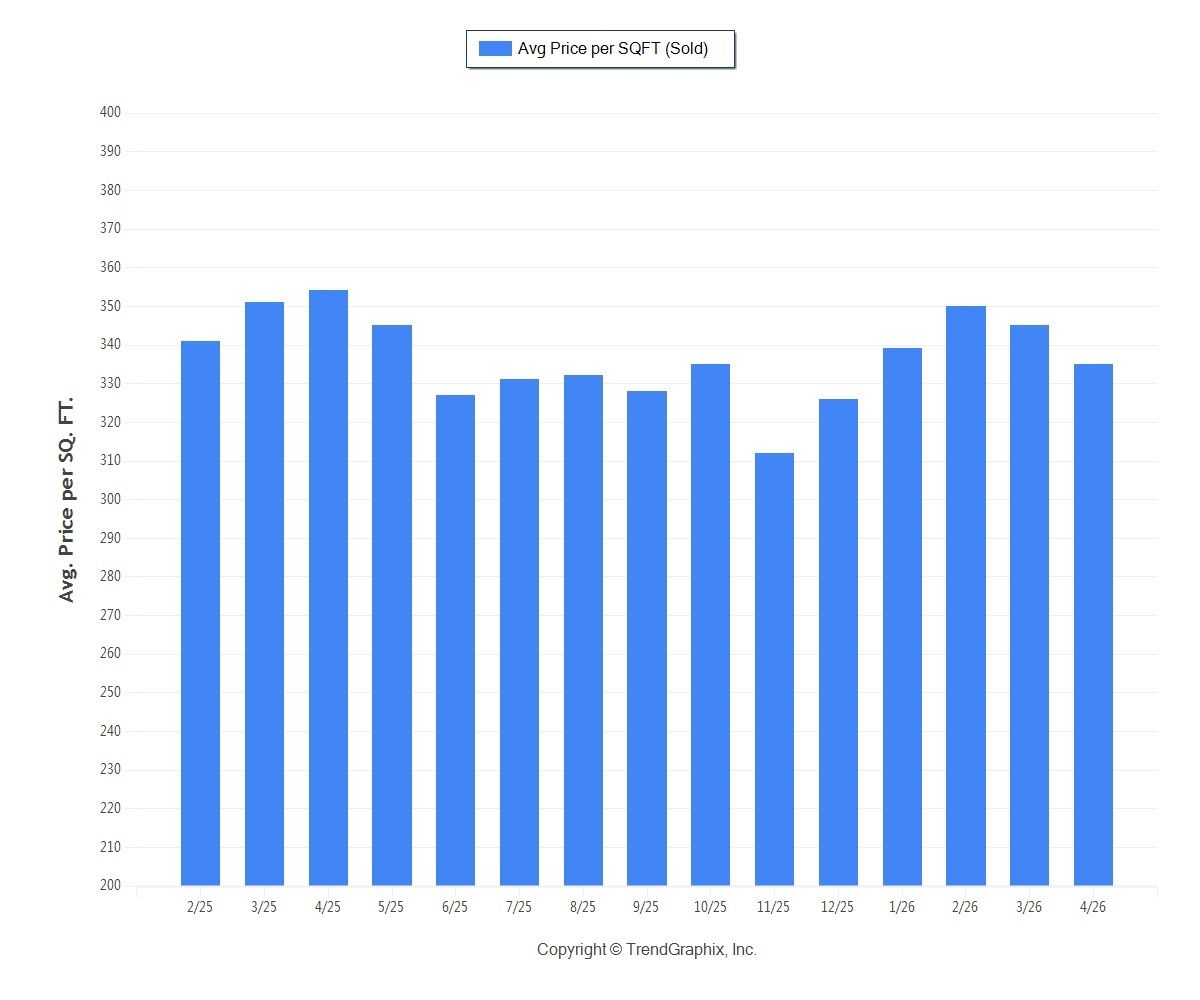
The Average Sold Price per Square Footage was Neutral: The Average Sold Price per Square Footage is a great indicator for the direction of property values. Since Median Sold Price and Average Sold Price can be impacted by the 'mix' of high or low end properties in the market, the Average Sold Price per Square Footage is a more normalized indicator on the direction of property values. The April 2026 Average Sold Price per Square Footage of $335 was down 2.9% from $345 last month and down 5.4% from $354 in April of last year.
*Based on 6 month trend – Upward/Downward/Neutral ** Based on 6 month trend – Rising/Falling/Remains Steady
*Data from the MLS published April 2026*